Foundation InsightsPRODUCT INNOVATION:
A research tool for cutting-edge cancer diagnostics
Role: Design Lead
Company: Foundation Medicine
01 Context
Foundation Medicine, Inc. (FMI) empowers physicians and researchers to help fight cancer through innovations in diagnostic testing and data analysis. In 2012, they were first to market with a comprehensive genomic profiling test for all solid tumors, providing hope for patients fighting cancer. FMI was founded by Eric Lander, president and founding director of the Broad Institute of MIT and Harvard, and backed by GoogleVentures.
02 Problem
Foundation Medicine has profiled more than 200,000 patients since its founding in 2010, amassing the world’s largest cancer genomic database. When I joined FMI in 2015, we faced a key challenge: How could we unlock this vast trove of information so that those fighting cancer had access to it?
Our aim was clear: Devise a data visualization portal that makes it easier for scientists and physicians to develop treatments and provide better cancer care.
03 Approach
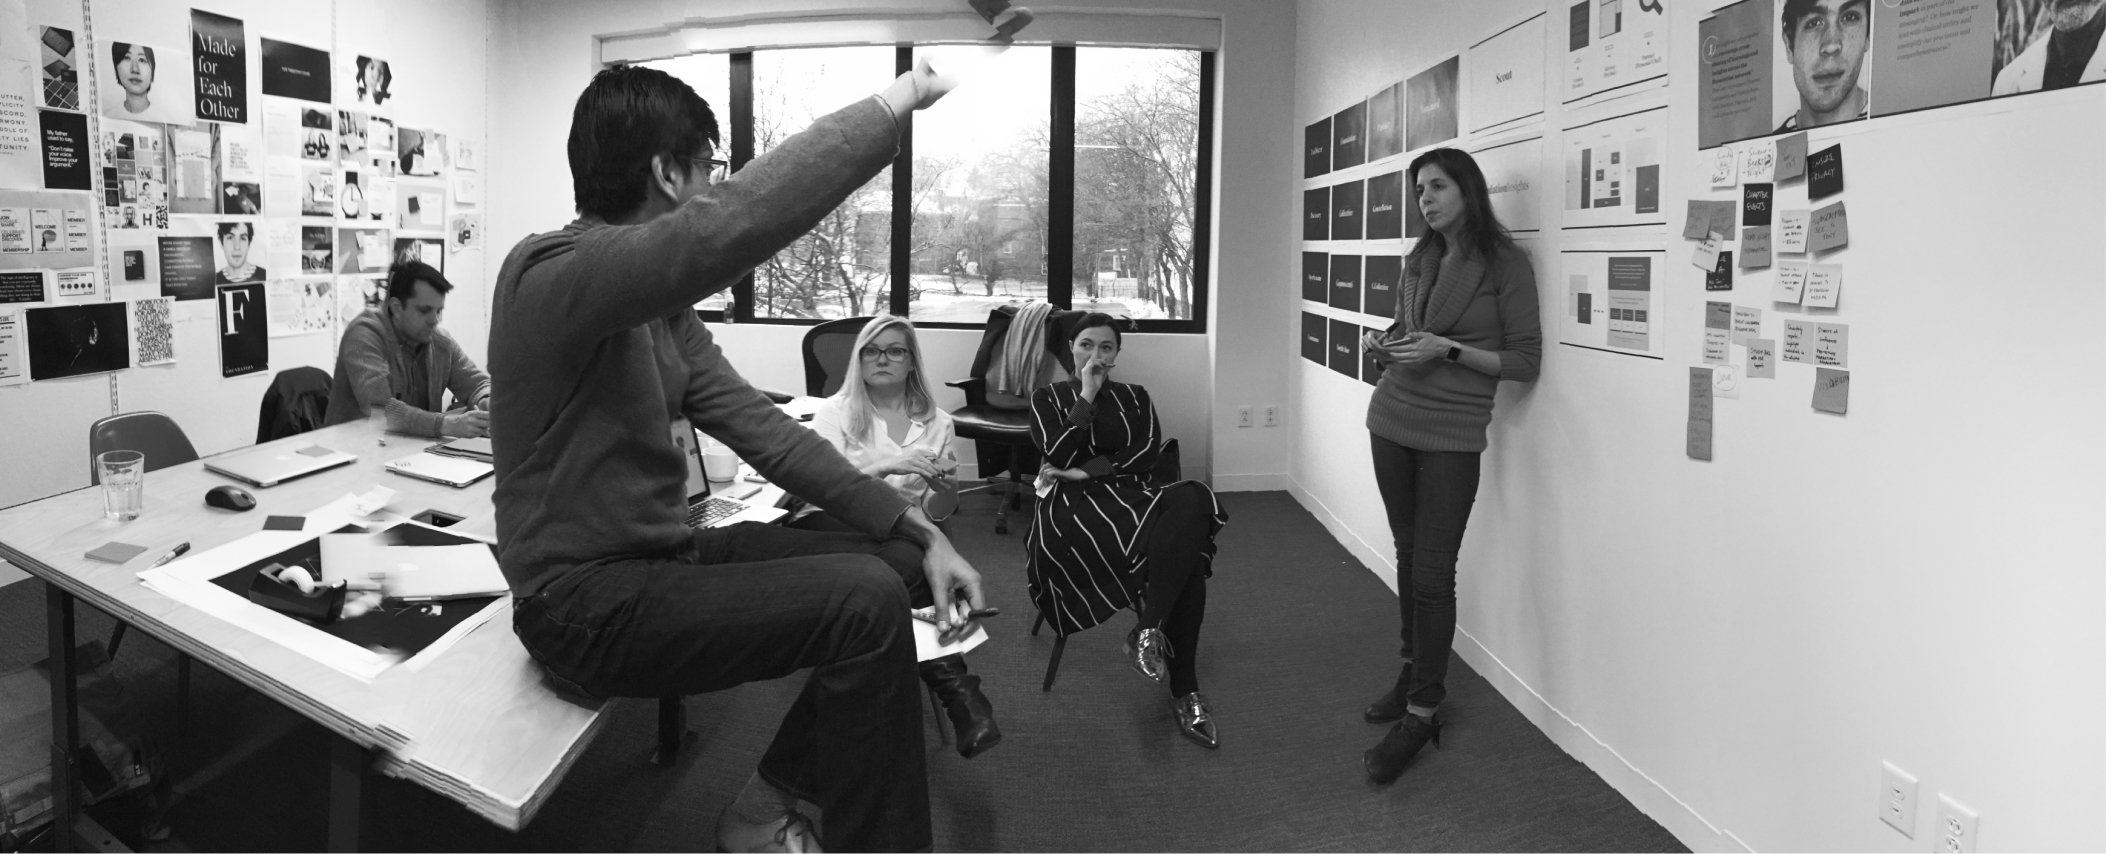
We conducted sprints with important stakeholders across the company, including bioinformaticists, software engineers, product strategists, molecular biologists, and support services colleagues. We ran these sprints— both independently and in partnership with IDEO—focused on one main goal: to understand how different participants would interact with the data.
We also hosted recurring conversations and group interviews with our in-house users and our commercial partners, such as Genentech. Through this process, we uncovered insights and layers of information that we needed to build into the Insights product.
Wireframing the Findings
Filters
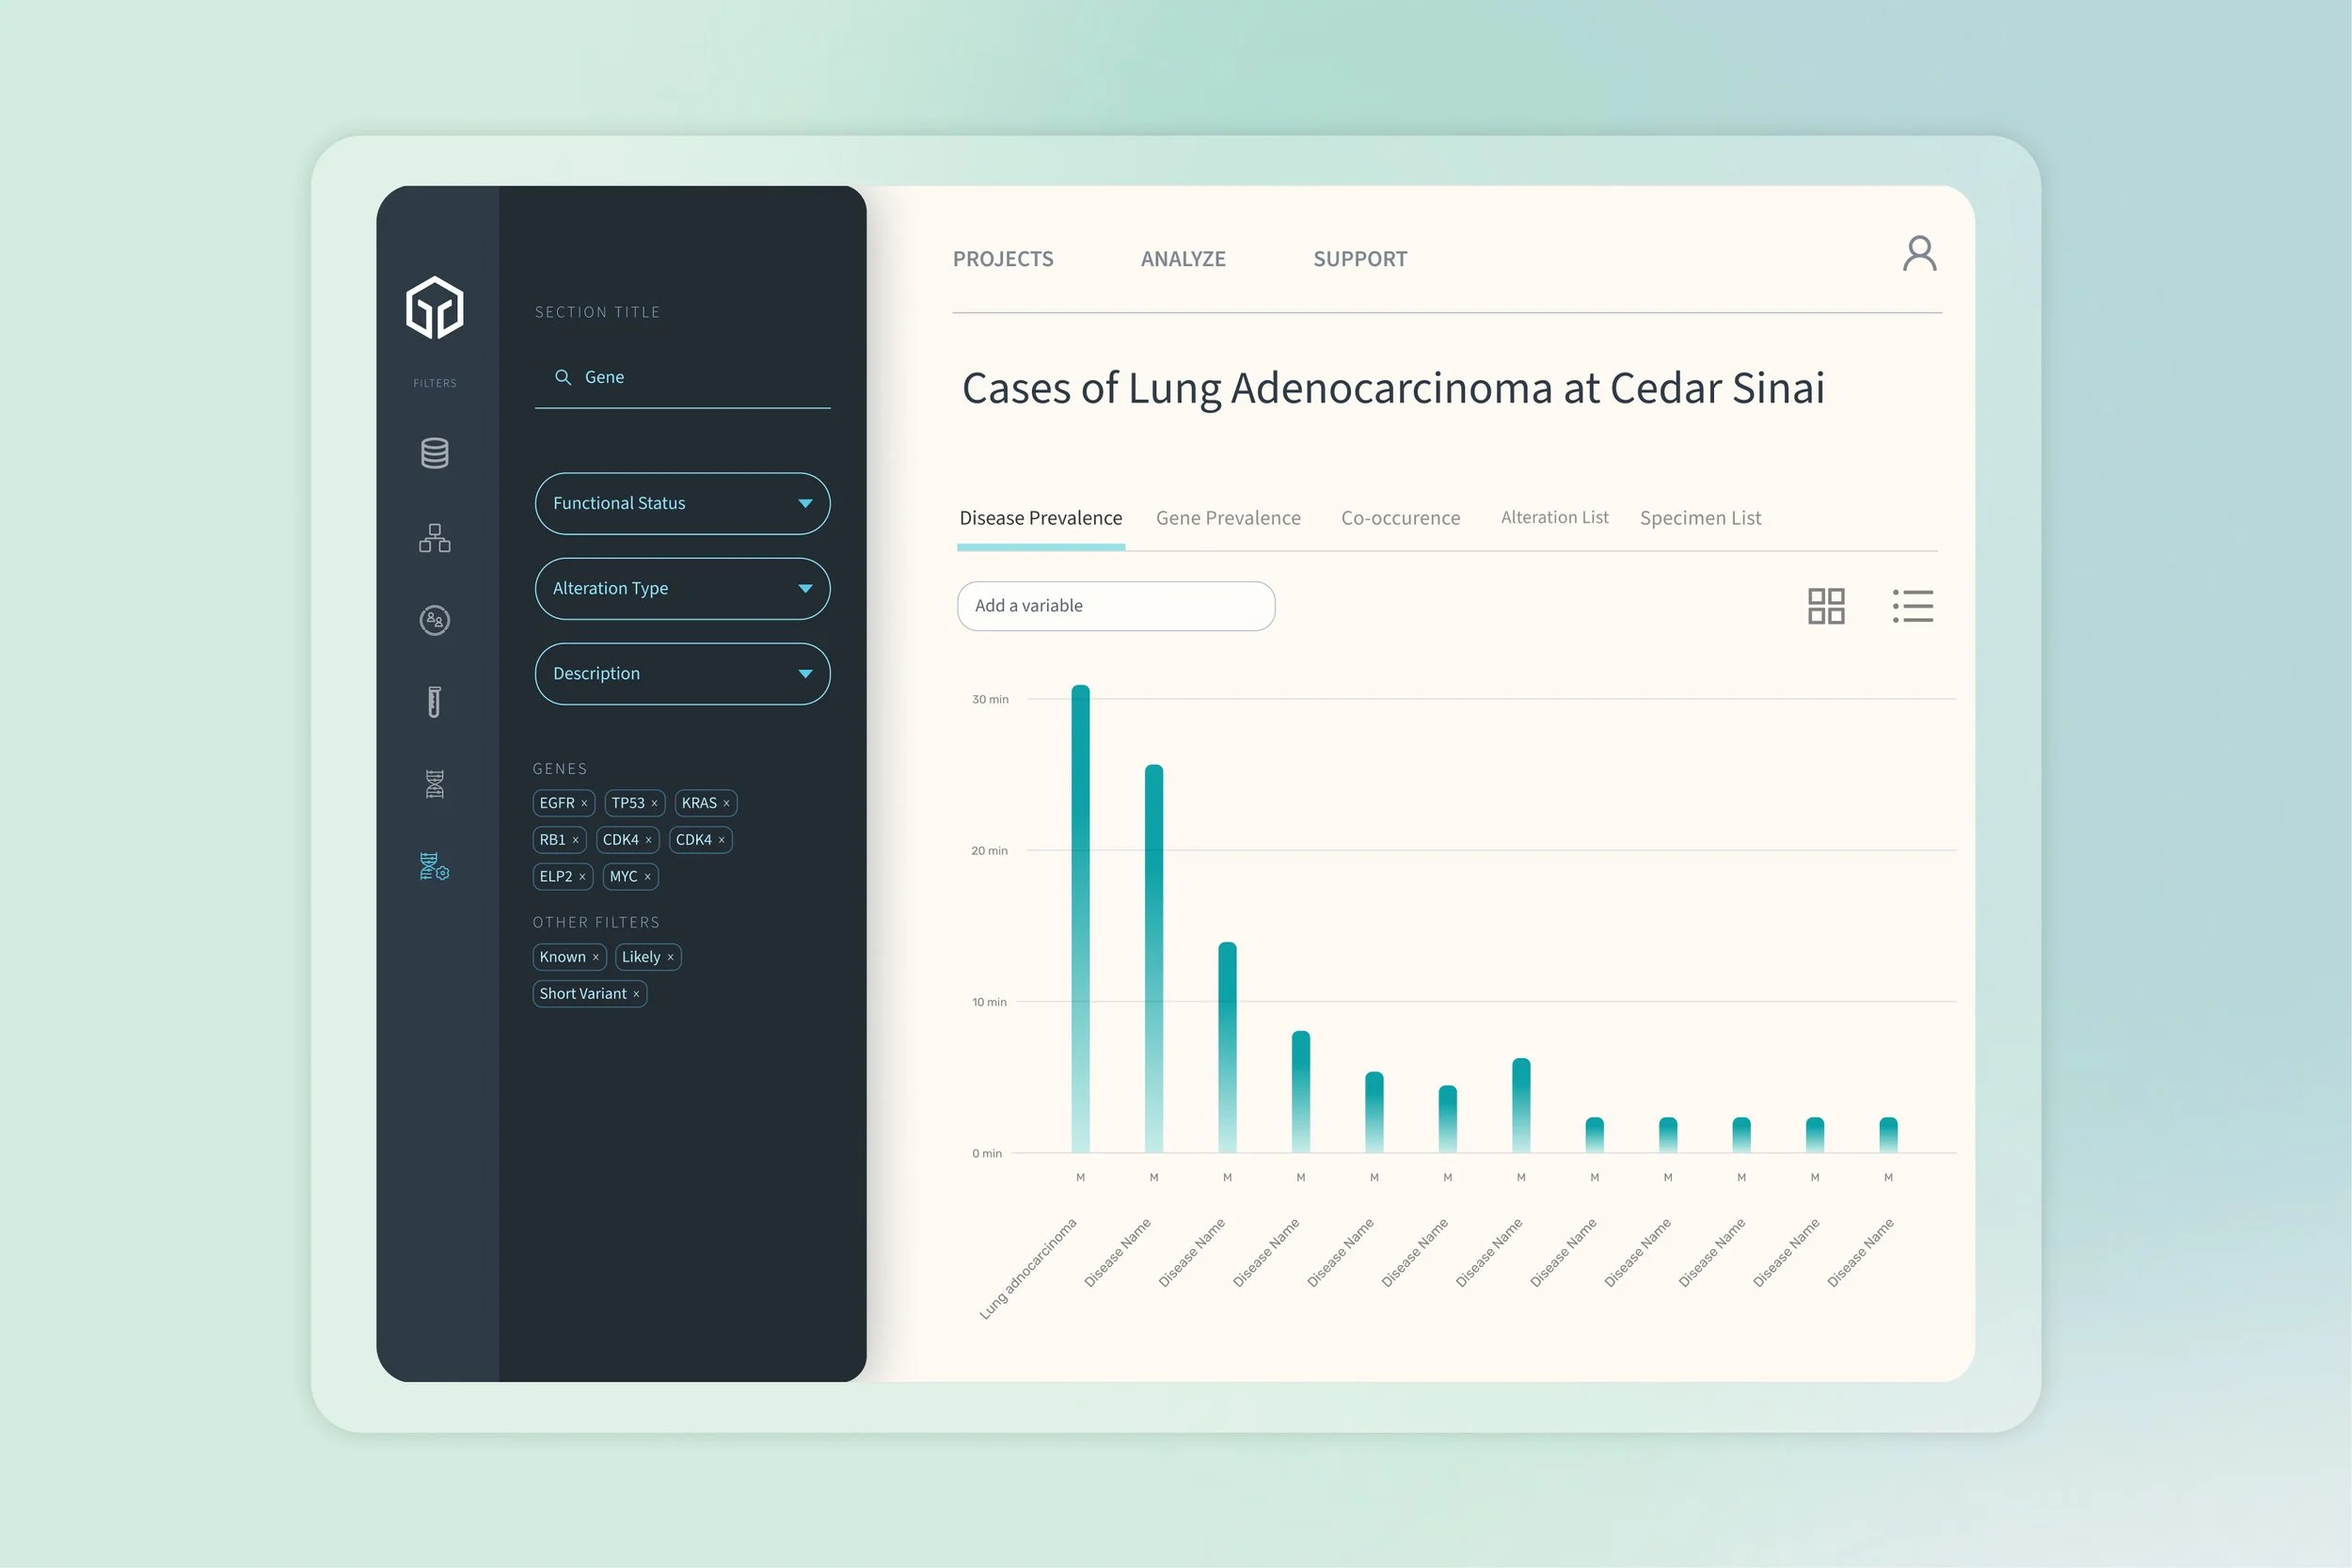
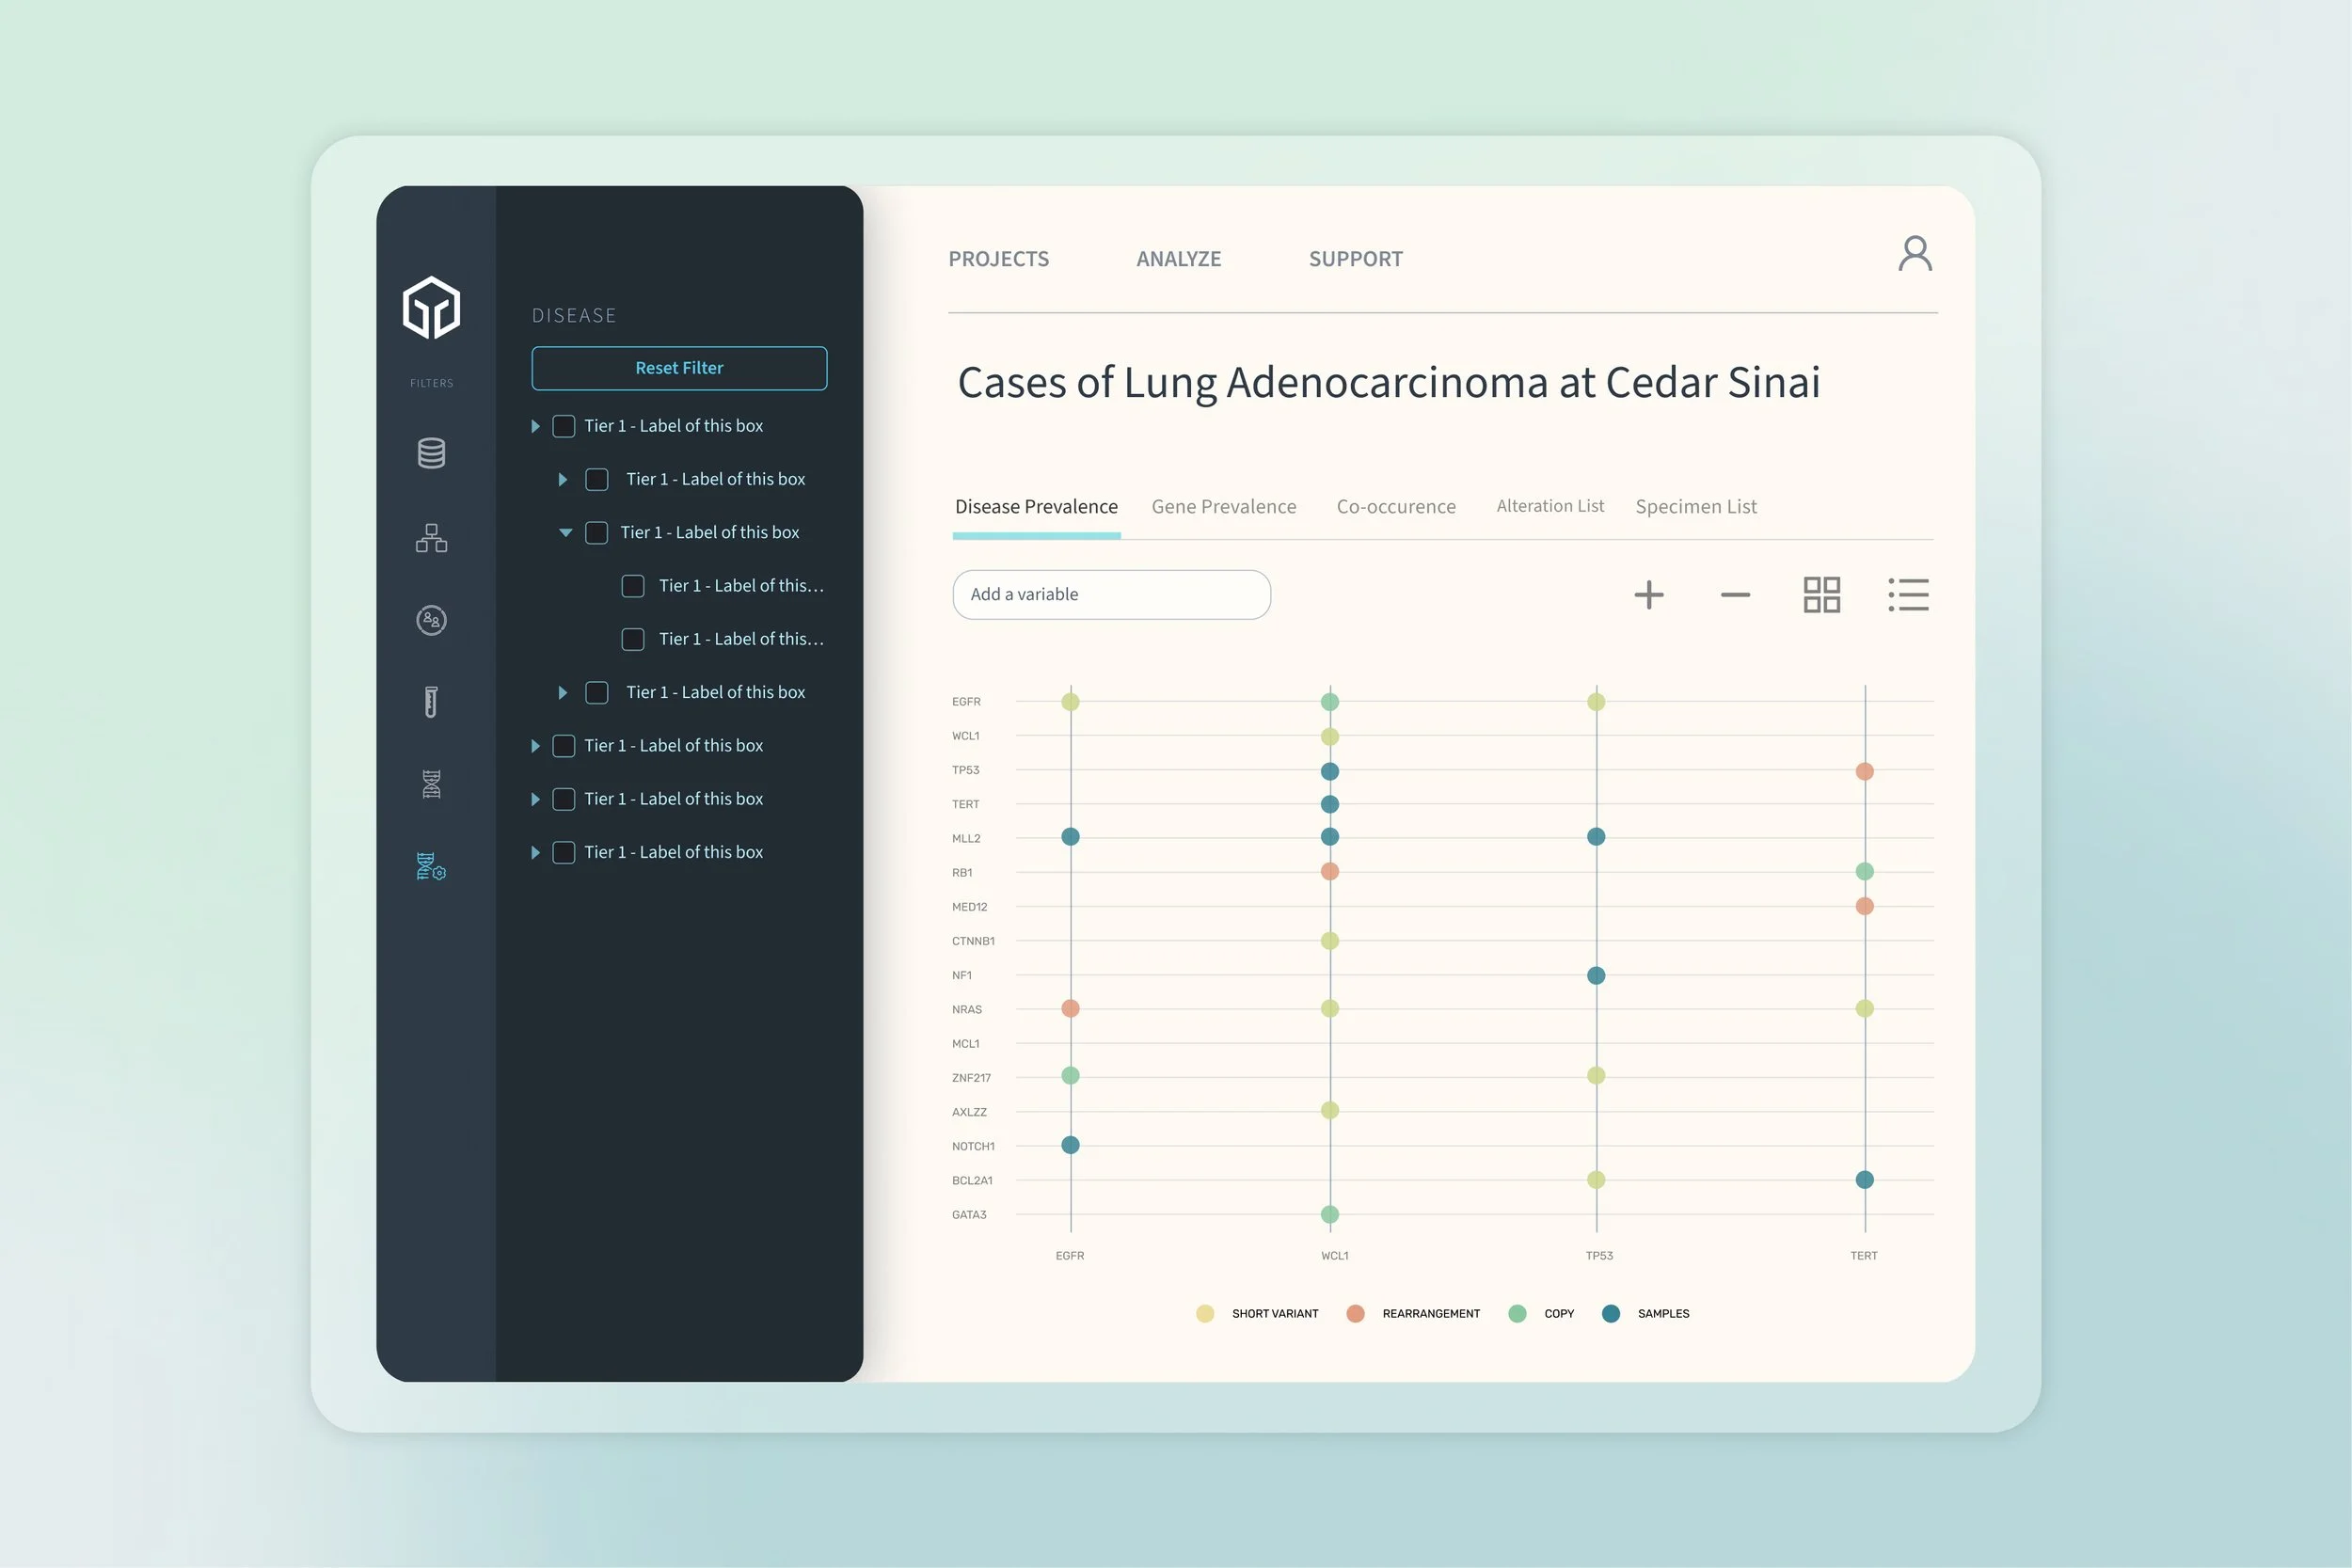
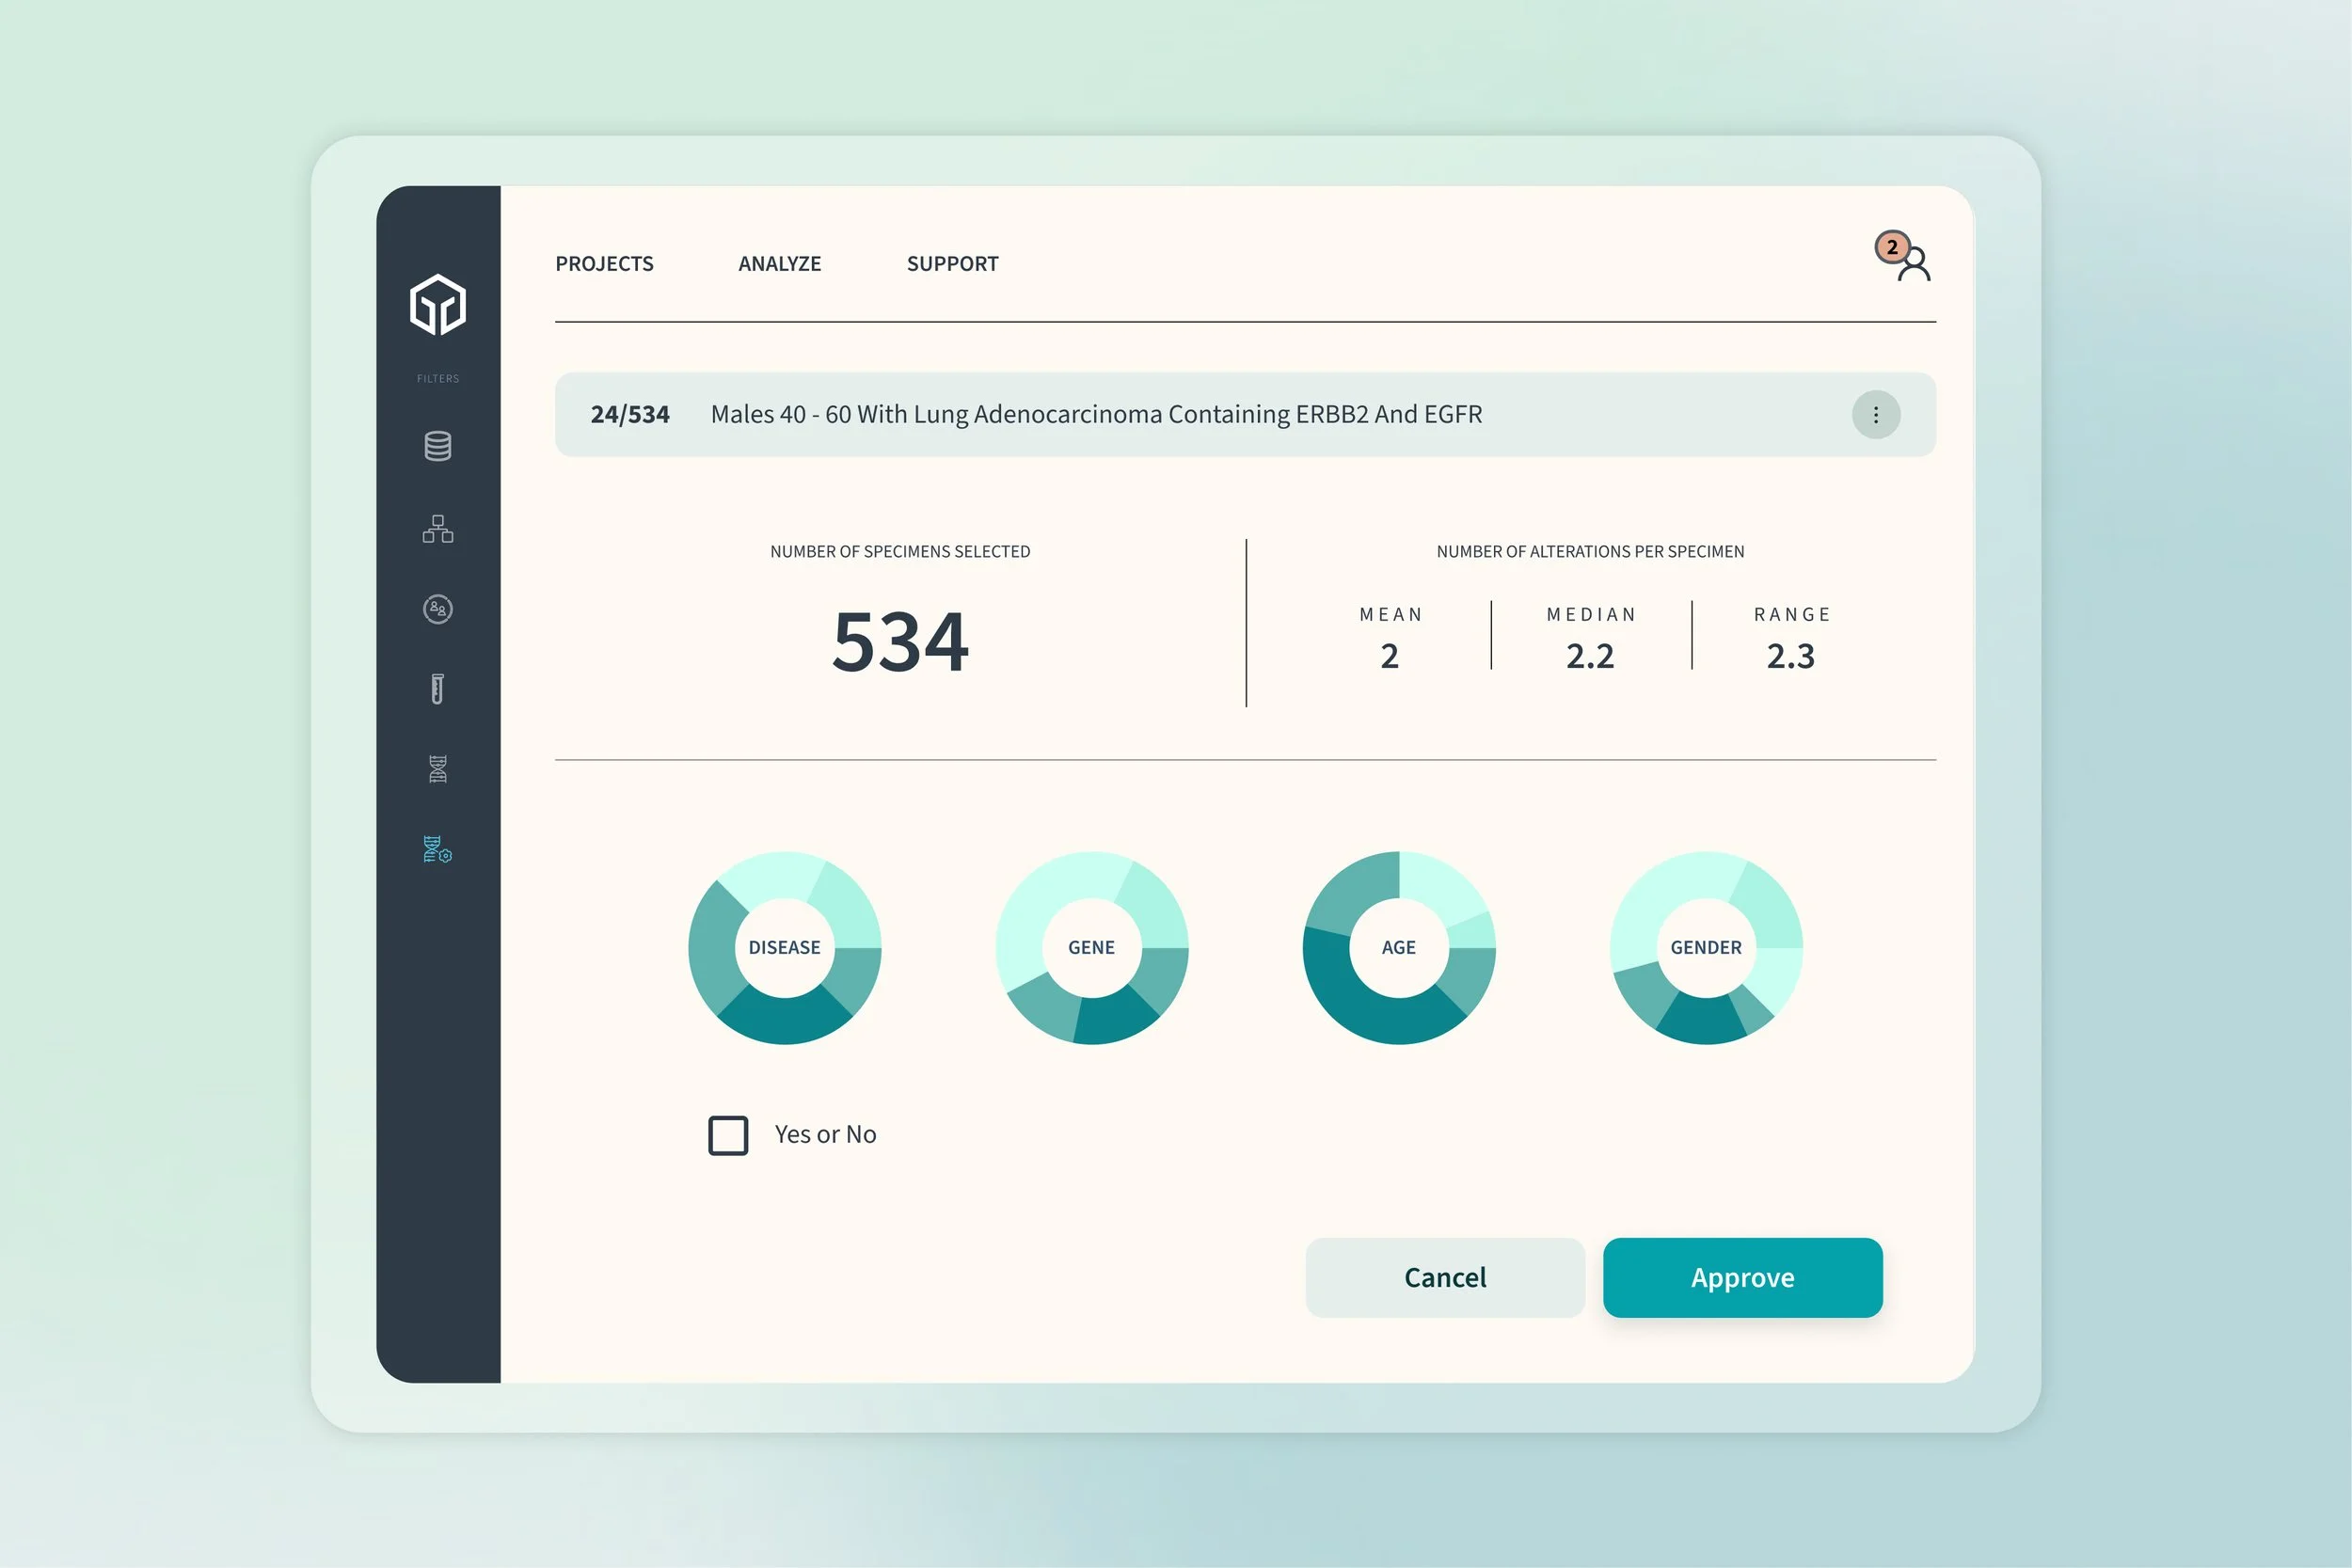
Users needed to be able to search the database using a specific set of filters, such as dataset, age, gender, cancer type, genomic mutation, etc. We identified the necessary filter categories and associated parameters through a series of interviews with various stakeholders. Users could adjust these parameters to find the insights they were looking for.
Plots
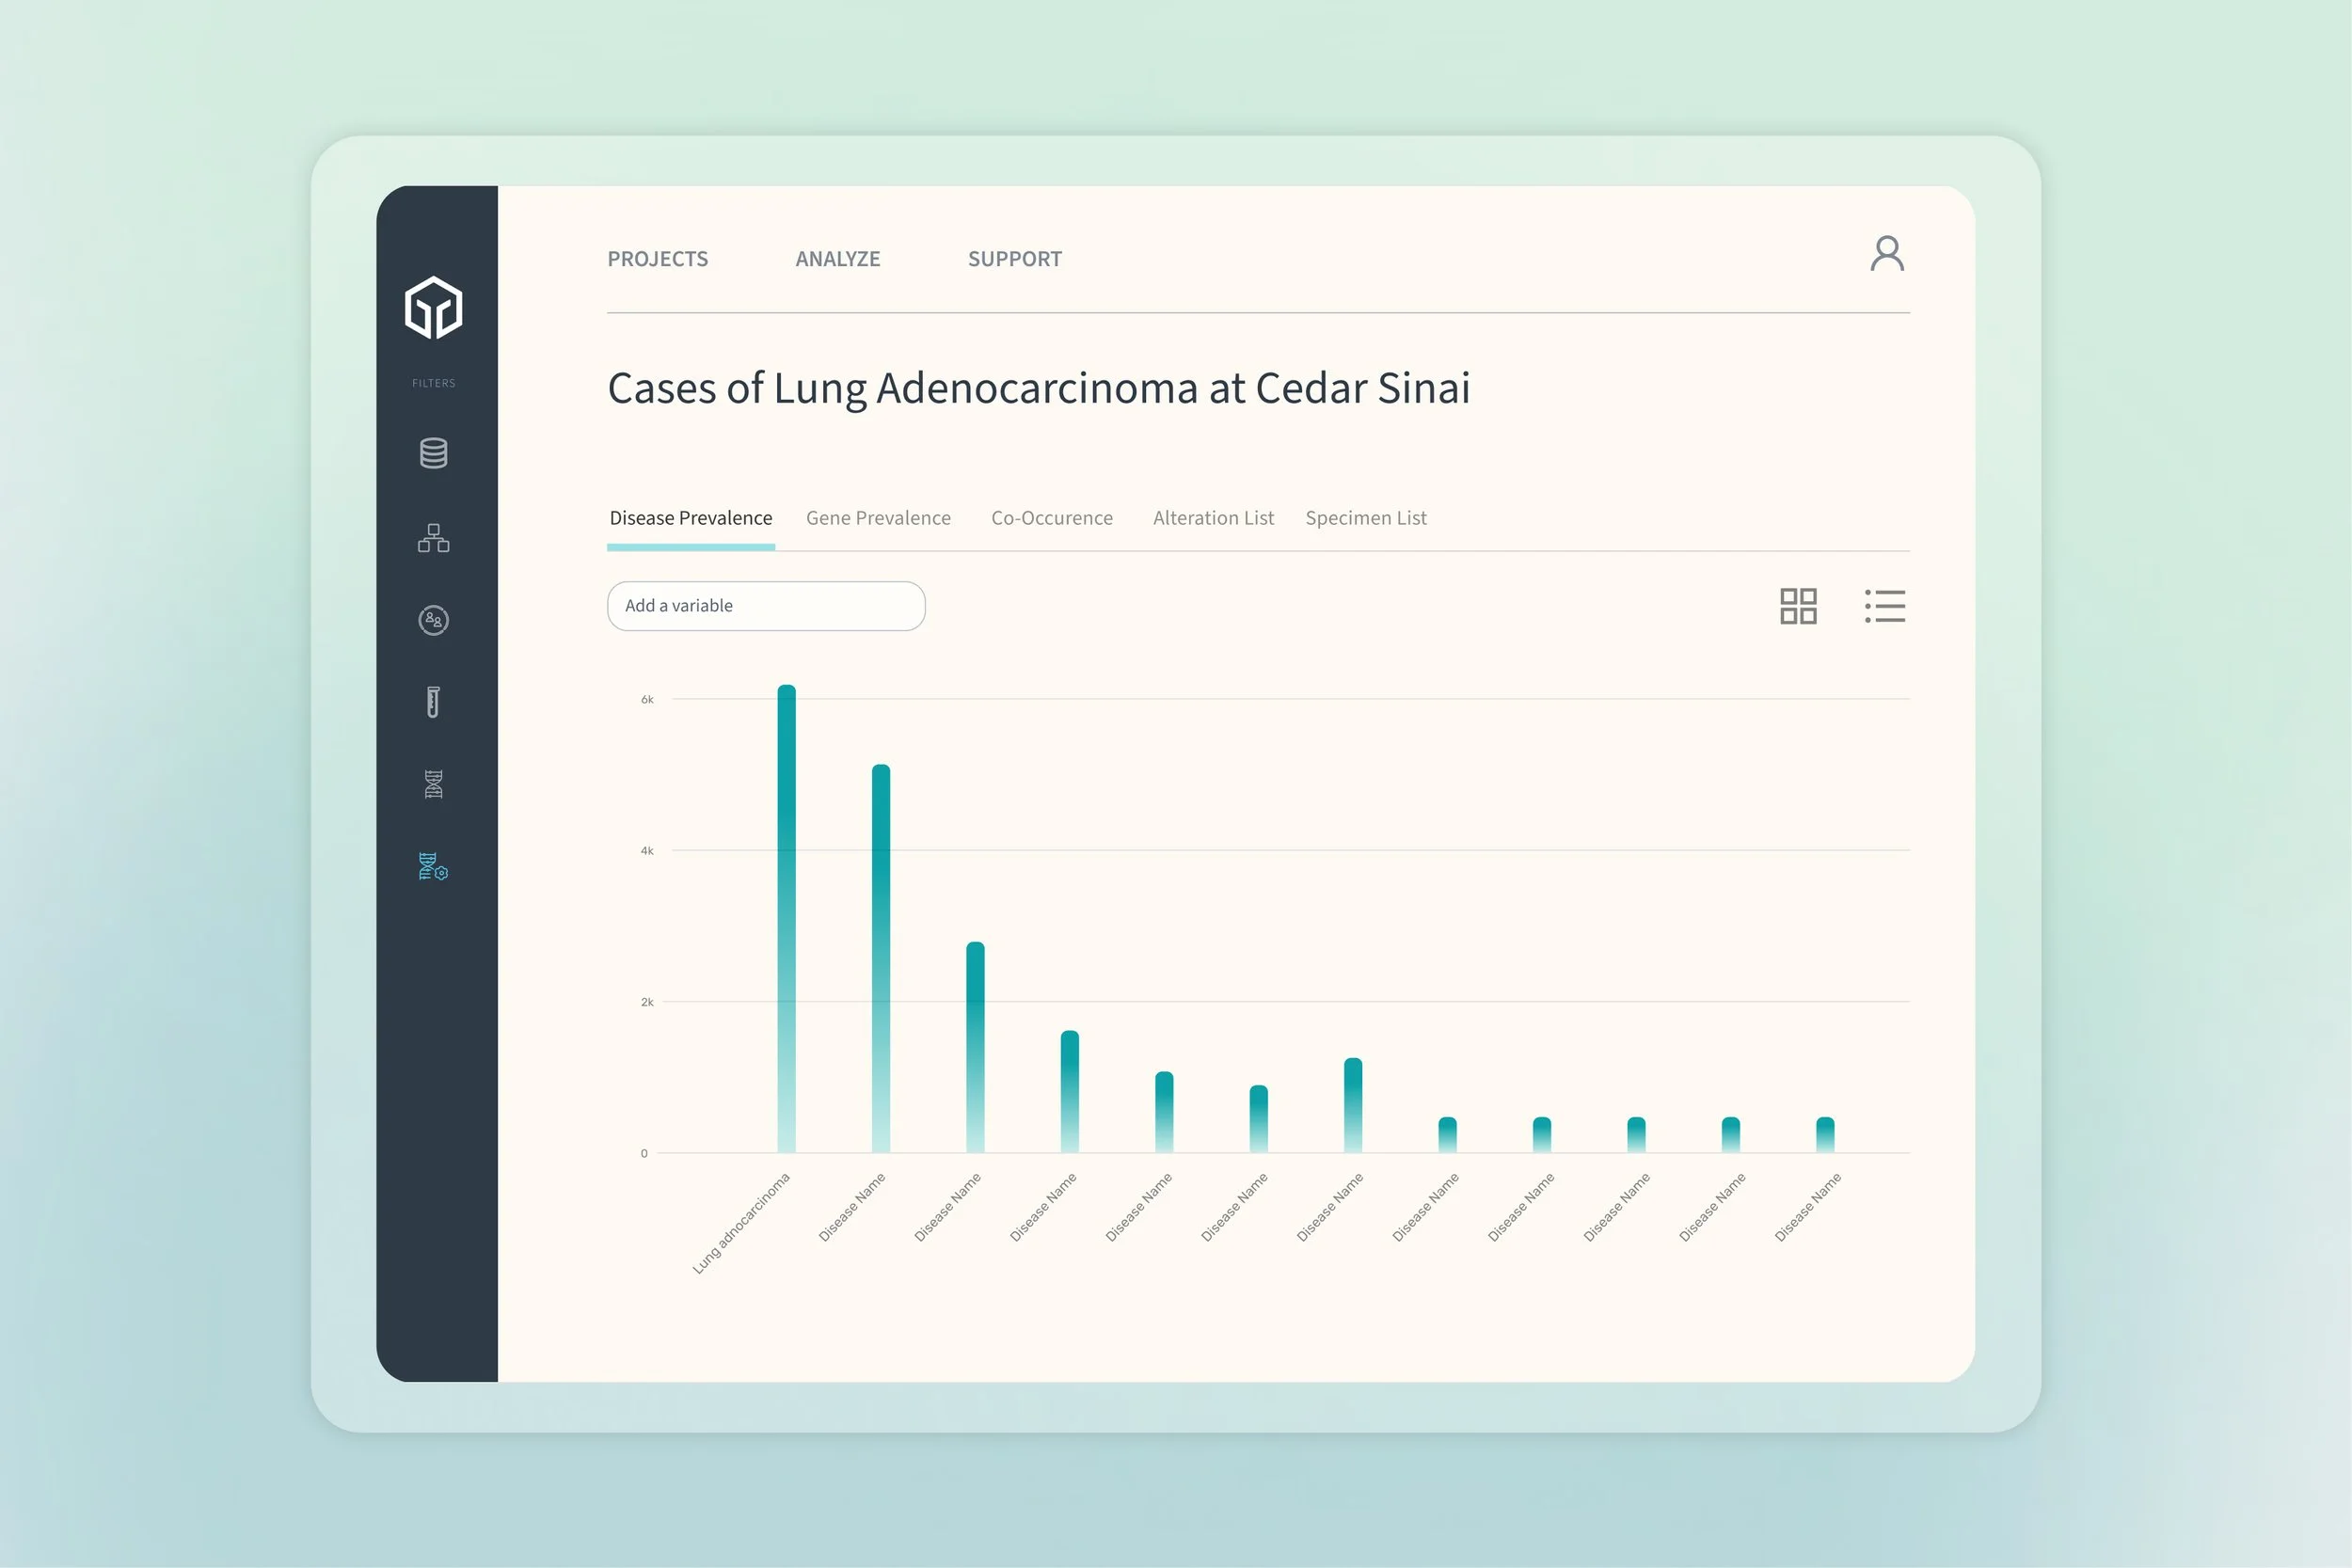
Statisticians, researchers, and scientists knew what types of charts they wanted to see when exploring the datasets housed by Foundation Insights. We identified several important visualizations that would reveal the significance of our data, including long-tail plots, co-occurrence charts, gene alteration breakdowns, and cohort and population graphs. Each of these charts offered a different view and relevance.
Projects vs. Browsing
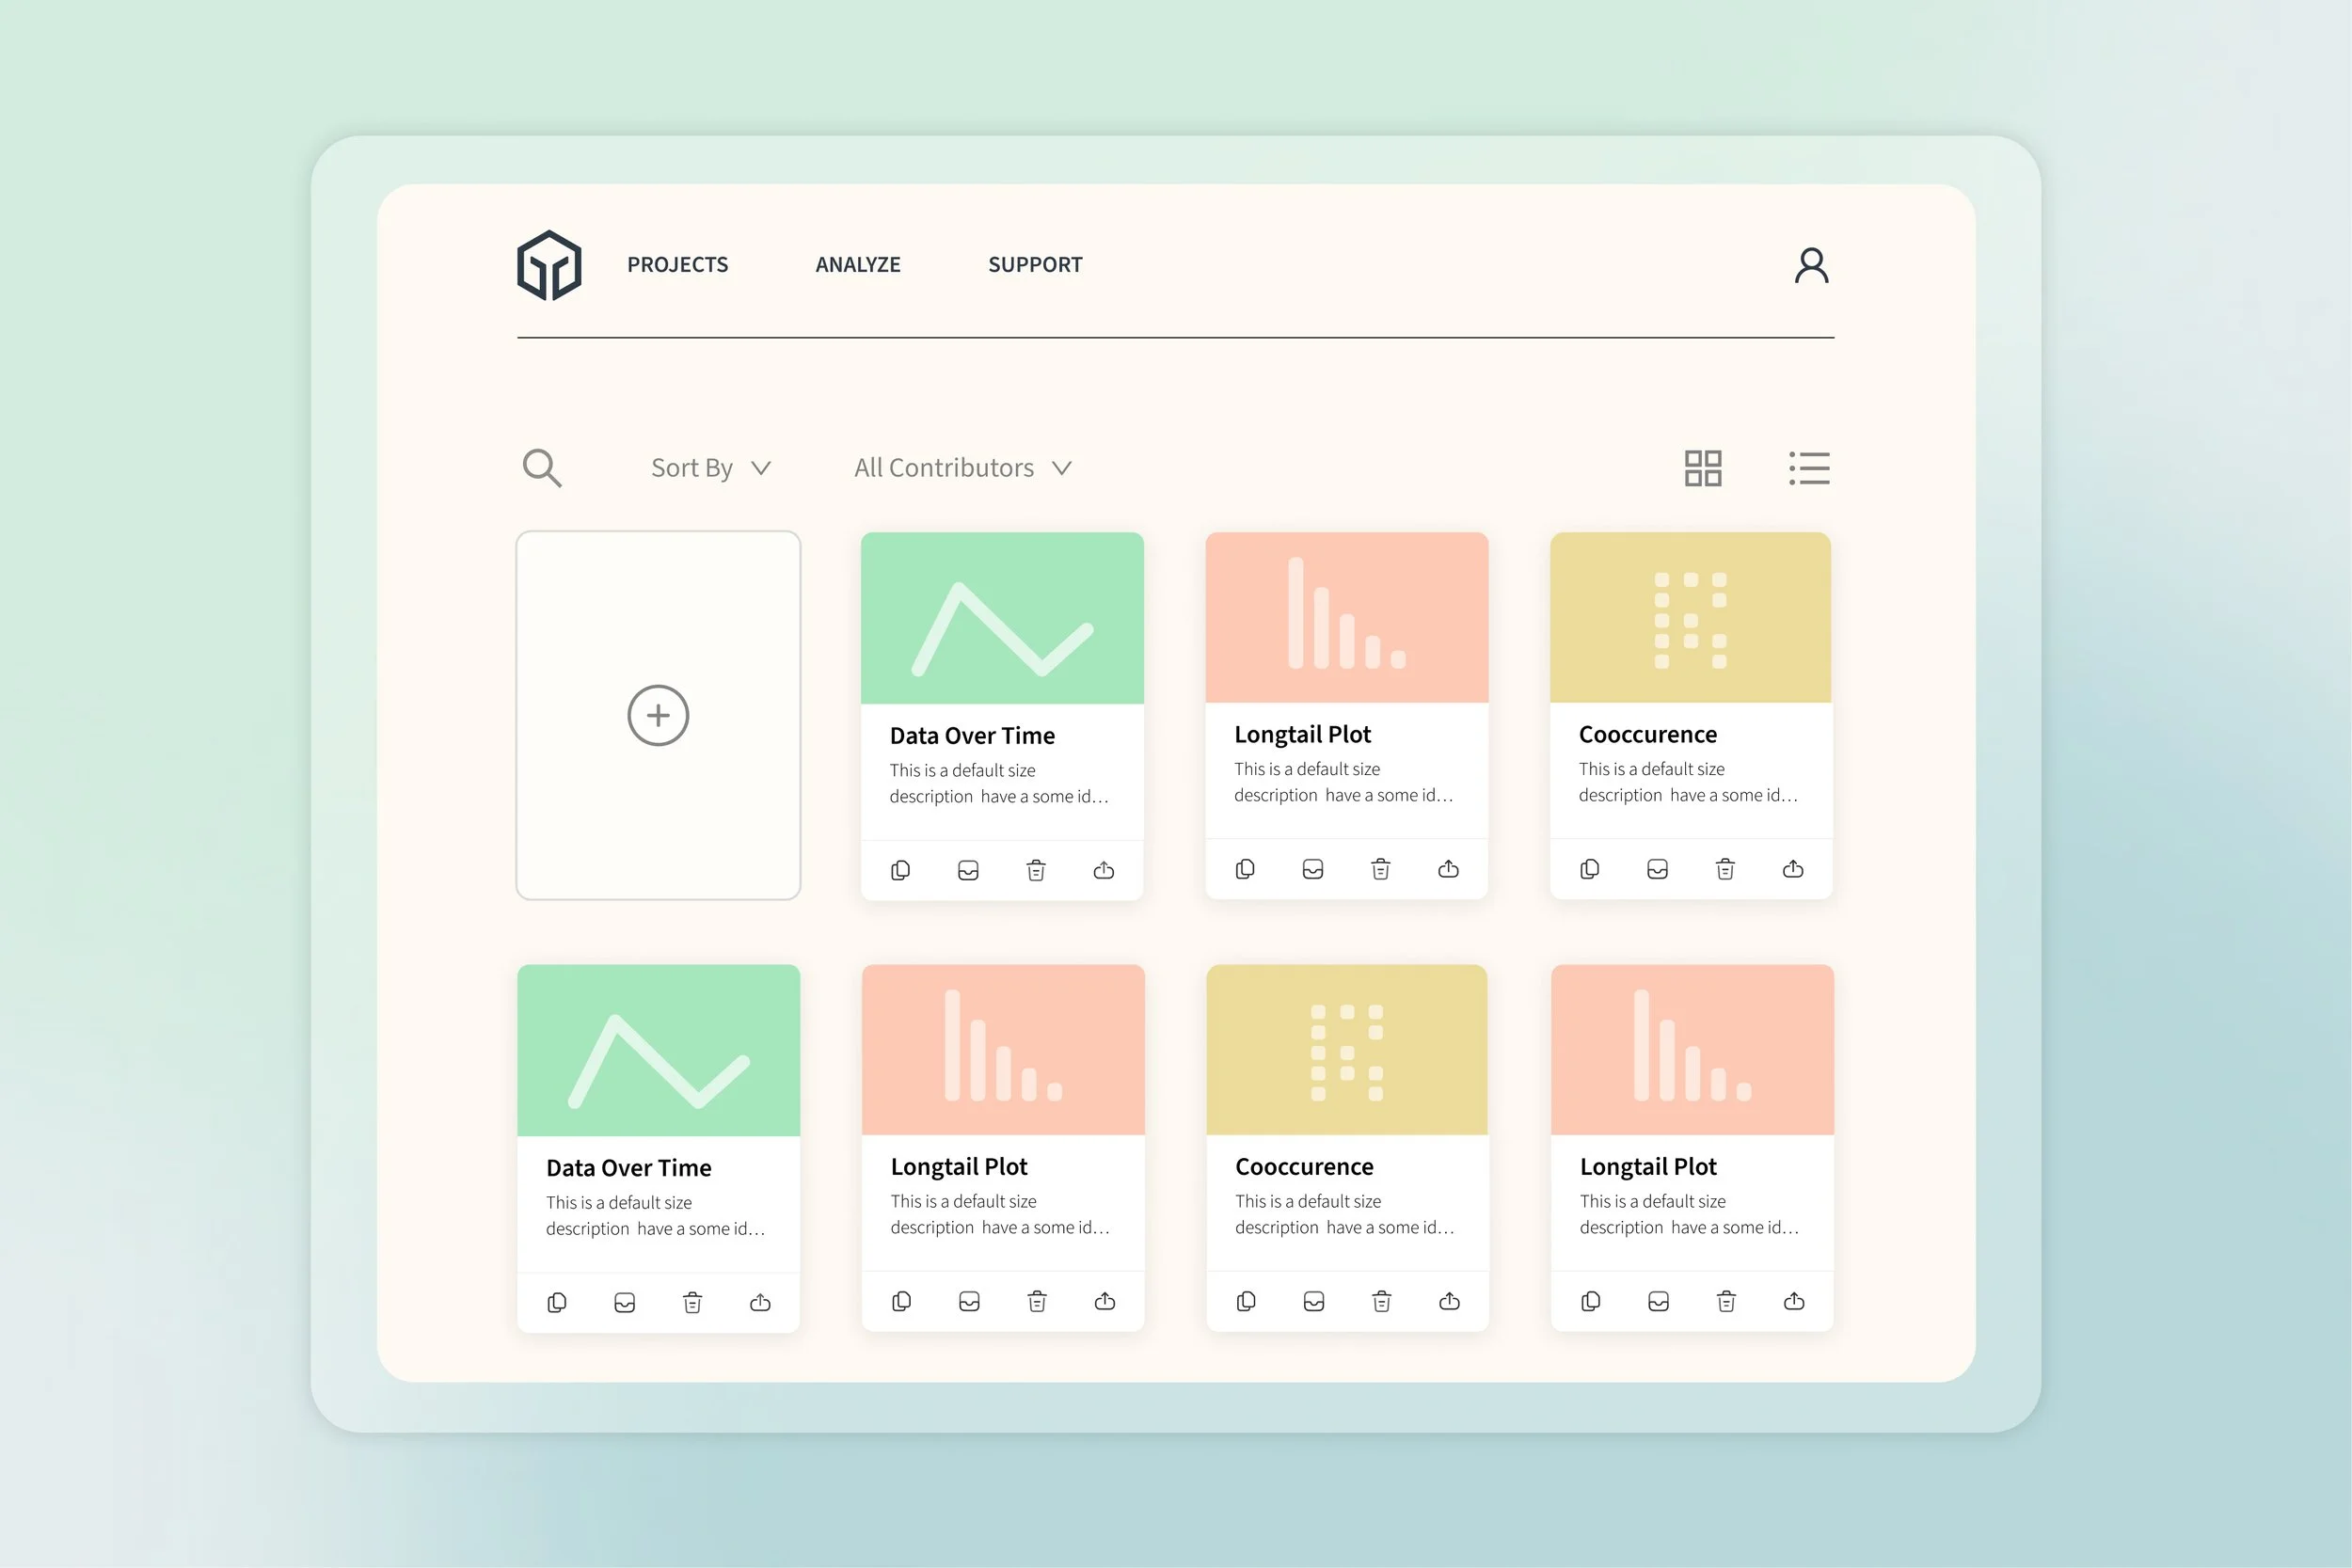
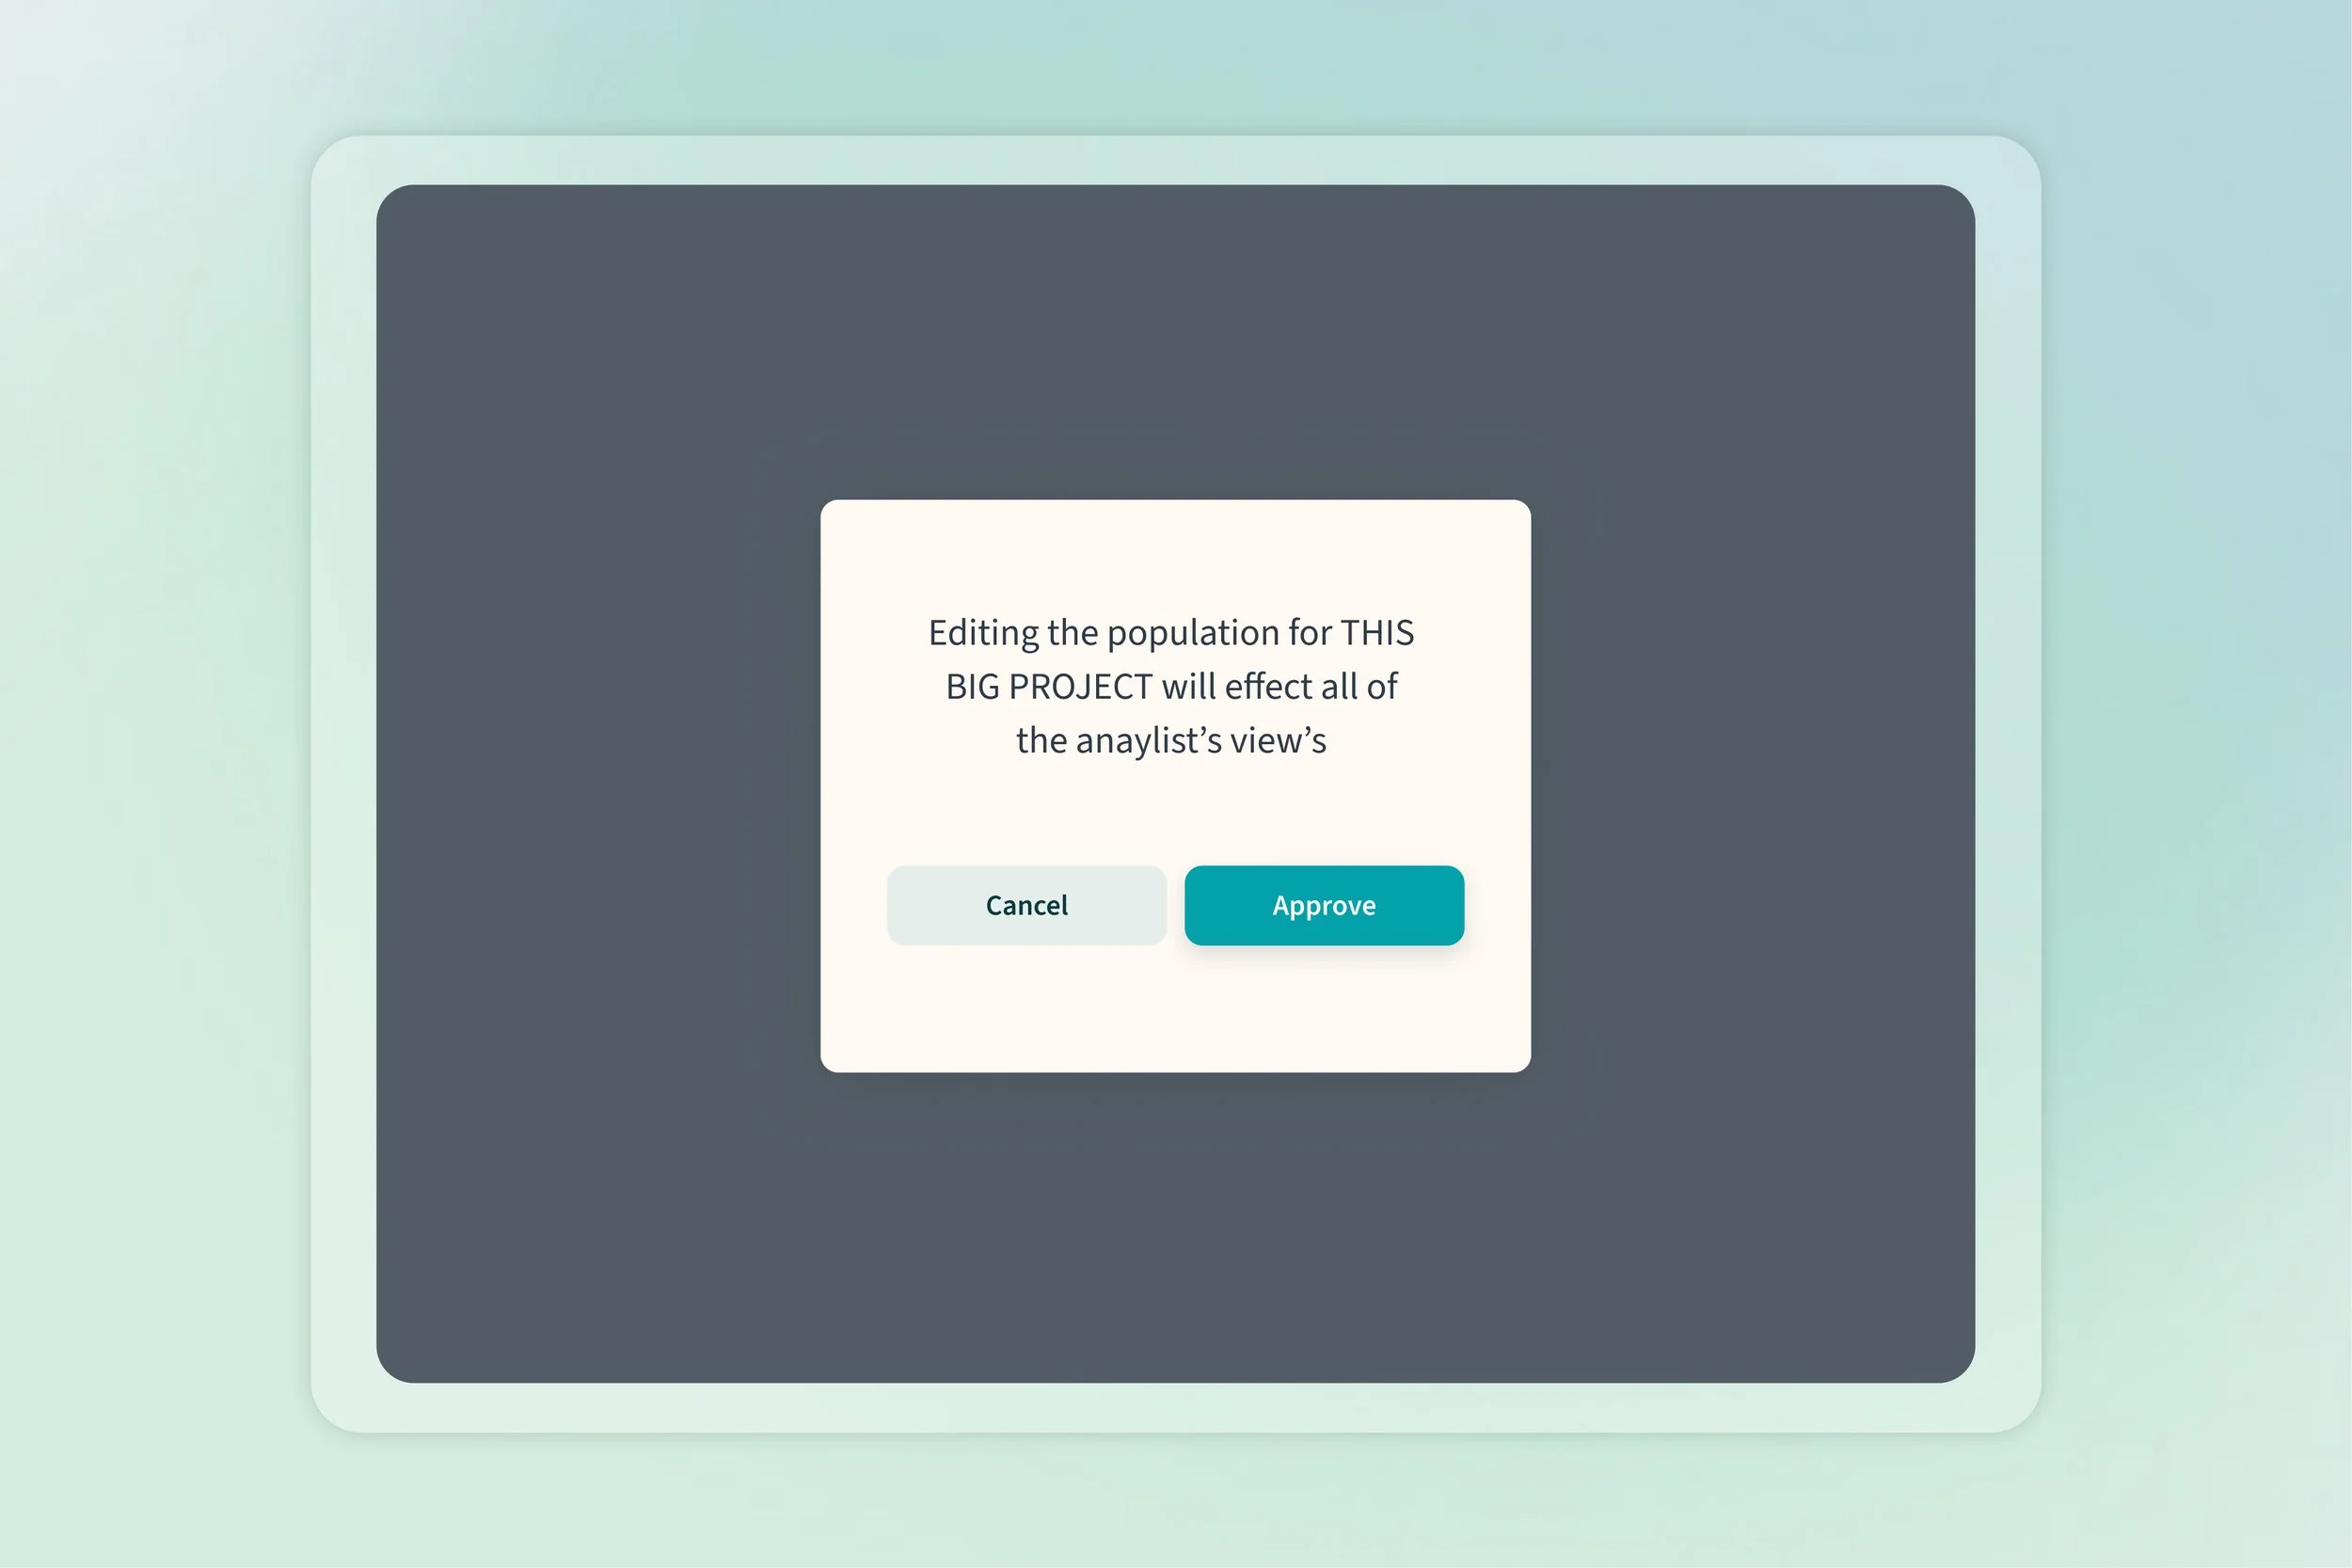
A recurring theme emerged during our interviews with stakeholders. They expressed two fundamentally different ways in which they wanted to interact with the FMI database. The first way was through a quick search to browse the information and ask questions as they arose. The second way was through a deep dive, which would allow them to carefully curate data, compare it, and save it to a project that could be shared with colleagues and business partners.
04 Impact
We created a tool that enabled physicians to gain deeper insights and better care for their patients, which also changed the way FMI did business.
The Foundation Insights tool proved incredibly valuable for a wide range of people working to advance precision medicine and improve the lives of people fighting cancer. This data visualization tool was particularly useful for designing clinical trials and helping pharmaceutical researchers understand populations with specific sets of conditions.


